 As I mentioned in my storage benchmarking post, storage performance is one of the critical infrastructure components underneath a mission-critical SQL Server.
My defacto storage benchmarking utility has been recently updated. Last October, Microsoft released a great free utility called diskspd, and it is freely available at http://aka.ms/DiskSpd. I consider it a very solid modern replacement to the much loved SQLIO. It is a synthetic I/O subsystem workload generator that runs via a command line. It produces similar tests to SQLIO, such as read or write, random or sequential, number of threads and thread intensity, and setting the block sizes, but also gives us some significant improvements.
The benefits of diskspd include:
- Sub-millisecond granularity on all tests, extremely useful for local SSDs and flash/hybrid storage arrays
- Ability to perform read AND write tests in the same test, similar to IOmeter
- Latency output metrics per read and write portions of the test, with standard deviation values
- CPU consumption analysis by thread during the tests
- Latency percentile analysis with percentiles 0-99 and then 99.9 up to 99.99999999 and then 100%, which is very useful for finding inflection points at the extremes which can skew test averages
- Can define the workload placement and size in the command line parameters, which is useful to keep the test cycles compact
- Ability to set the entropy values used in the workload file generation
- Output is in plain text with an option to output to XML, which is extremely useful for a result we can convert and use elsewhere
So, how do we use this utility? Simple. Download the executable file from TechNet (source code is available at GitHub for those who are interested)Â and extract the archive to your file system.
For this example, we’ll use c:\diskspd. Copy the diskspd.exe file from the platform folder of your choice into the c:\diskspd folder to keep the pathing simple.
Some of the command line parameters are as follows.
| Parameter | Description |
| -b | Block size of the I/O. Specify your unit of size (K/M/G). For example, 8KB block tests should use the flag -b8K. |
| -c | Creates workload file(s) of the specified size. Specify your unit of size (K/M/G). For example, a 50GB workload file can be created with the parameter -c50G. |
| -d | Test duration, in seconds. Tests longer than 30 seconds each are usually sufficient, but longer tests are suitable for production workload testing. |
| -h | Disable hardware and software caching, from within the Windows OS layer. This mimics SQL Server behavior. |
| -L | Capture latency information. Vitally important to SQL Server performance testing. |
| -o | Outstanding I/Os (queue depth) per worker thread. Setting this higher increases the intensity of the test, which pushes your storage harder. |
| -r | Random or sequential. If -r is specified. Random tests are performed. If this parameter is omitted, sequential tests are performed. |
| -t | Worker threads. I usually set this to the number of non-hyperthreaded cores on the server. |
| -w | Read and/or write percentage, based on the percentage of writes. If the test is a pure read test, set this to zero. If the test is a pure write test, set to 100. You can mix reads and writes. For example, if you want to perform a 20% write / 80% read test, set the parameter as -w20. |
| -Z | Workload test write source buffers sized to a specific number of bytes. Specify your unit of size (K/M/G). The larger the value, the more write entropy (randomness) your workload data file contains. Experiment with this value based on your system and database workload profiles. For example, 1GB source buffer sizes could use the flag -Z1G. |
At the end of the line, specify the workload placement location and file name.
Other parameters exist for more advanced workload simulations, so read the great documentation that accompanies the executable.
What if you want to simulate SQL Server? If we are going to do OLTP-type workloads, use the following sample command as a place to get started.
diskspd -b8K -d2 -h -L -o4 -t4 -r -w20 -Z1G -c50GÂ e:\diskspd\io.dat > resultssql.txt
This test executes an 80%/20% read/write test with an 8KB block size test on a 50GB workload file located on the E: drive with four worker threads, each with four outstanding I/Os, an intensity of four outstanding I/O’s per thread, and with a write entropy value seed of 1GB. It saves the output text into a results.txt output file for reference.
You can also save this into a batch or PowerShell script to make this test easily repeatable.
Execute this with Administrator privileges or else you might see an error code about needing permissions to write the file or else it might take longer.

The output presents some fantastic granular data. Let’s investigate the sections.
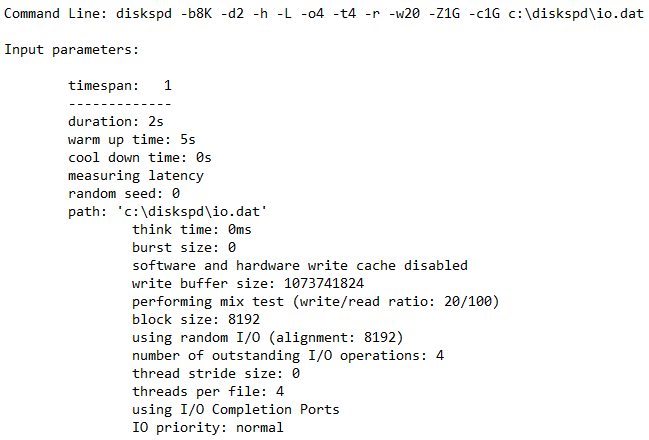
The header simply shows the parameters that you used to run the individual test, including the command line itself.

The next section shows the CPU consumption, broken out by user and kernel time by worker thread, for the test cycle.

The next section gets more interesting. We now have the IOPs and throughput metrics, broken out by worker thread and by read and write, for the test. IOPs by read and write matters the most here, with throughput a close second. The operations by thread should be very similar. Higher IOPs and throughput are good values.

The last section is the most interesting. It presents a percentile analysis of the storage performance from the minimum value up to the maximum value. Look for points of inflection in the data. In this test, you can see that we had a significant inflection point between the 99th and 99.9th percentile. Statistically speaking, less than one percent of our I/Os in this test had a latency greater than 4.123 milliseconds, and less than one tenth of one percent had this latency greater than 11.928 milliseconds.
In conclusion, storage testing with diskspd has never been easier! This utility is now my defacto storage benchmarking tool. Give it a try!
Stay tuned – I’ve got a surprise coming!
Thanks for the article. I am seeing some strange CPU issues. During the tests my CPU is 80% pegged (through out the test). Similar test when i do with SQLIO , i don’t see any CPU contention at all. Below are the two commands that i have tried on 32 core server.
diskspd -c50G -d90 -w30 -t32 -o4 -b64K -L -h s:\diskspd\io.dat
diskspd -c50G -d60 -w30 -t2 -o4 -b64K -L -h -si s:\diskspd\io.dat >> resultssql.txt
That’s strange. It should not be that high with only a four operation per thread test. Were both tests causing you the CPU spikes (-t2 should not do that on this system profile)? Can you describe your system that you are testing, down to the details on how the storage is connected to the server?