Performance statistics are critically vital for the long-term health and capacity management of an enterprise environment. Unless a third-party performance statistics collection utility, such as Microsoft System Center, is already in place in an environment, Perfmon on each Windows Server can be configured to constantly record performance statistics for future use.
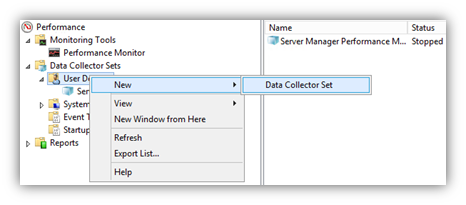
Open Windows Perfmon and expand the Data Collector Sets, User Defined tree item.

Right-click on User Defined, select New, and select Data Collector Set.
Name the Data Collector Set appropriately, and select Create manually (Advanced).

Select Create data logs and then check Performance Counter. Select Next.

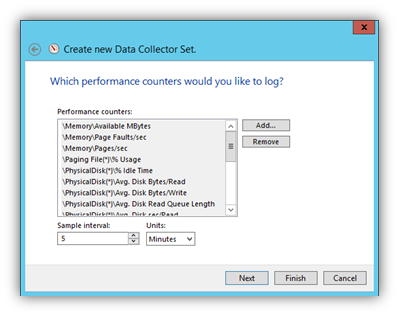
Set the Sample interval to five minutes. Next, select the following counters.
Note: If a counter has multiple instances of a selected object, make sure you select

Windows Server Counters
| Counter Group | Counter Set |
| Memory | Available Mbytes |
| Page Faults / sec | |
| Pages / sec | |
| Network Interface | Bytes Received / sec |
| Bytes Sent / sec | |
| Paging File | % Usage |
| PhysicalDisk | % Idle Time |
| Average Disk Bytes / Read | |
| Average Disk Bytes / Write | |
| Average Disk sec / Read | |
| Average Disk sec / Write | |
| Disk Read Bytes / sec | |
| Disk Reads / sec | |
| Disk Write Bytes / sec | |
| Disk Writes / sec | |
| Processor | % Privileged Time |
| % Processor Time | |
| % User Time | |
| Processor Information | % of Maximum Frequency |
| System | Processor Queue Length |
If this server is virtualized on VMware vSphere, add the following VMware-specific counters.
| Counter Group | Counter Set |
| VM Memory | Memory Active in MB |
| Memory Ballooned in MB | |
| Memory Swapped in MB | |
| Memory Used in MB | |
| VM Processor | % Processor Time |
| CPU stolen time | |
| Effective VM Speed in MHz | |
| Host processor speed in MHz |
If the server is virtualized on Microsoft Hyper-V, or is a Hyper-V host, add the following Hyper-V-specific counters.
| Counter Group | Counter Set | Counters (Otherwise select all) |
| Overall health | Hyper-V Virtual Machine Health Summary | %Guest Run (_Totals)
%Hypervisor Run Time (_Totals) %Idle Run Time (_Totals) |
| Hyper-V Hypervisor | ||
| Processor | Hyper-V Hypervisor Logical Processor | |
| Hyper-V Hypervisor Root Virtual Processor | ||
| Hyper-V Hypervisor Virtual Processor | ||
| Memory | Hyper-V Hypervisor Partition | 2M GPA Pages
Deposited Pages Virtual Processors |
| Hyper-V Root Partition | ||
| Hyper-V VM Vid Partition | Physical Pages Allocated
Remote Physical Pages |
|
| Networking | Hyper-V Virtual Switch | |
| Hyper-V Legacy Network Adapter | ||
| Hyper-V Virtual Network Adapter | ||
| Storage | Hyper-V Virtual Storage Device | |
| Hyper-V Virtual IDE Controller |
If the server contains one or more SQL Server instances, add the following counters for each SQL Server instance.
| Counter Group | Counter Set |
| Process (sqlserver.exe) | % Processor Time |
| % Privileged Time | |
| SQL Server:Buffer Manager | Lazy writes/sec |
| Page life expectancy | |
| Page reads/sec | |
| Page writes/sec | |
| SQL Server:Memory Manager | Total Server Memory (KB) |
| Target Server Memory (KB) | |
| Memory Grants Pending | |
| SQL Server:Access Methods | Forwarded Records/sec |
| Full Scans/sec | |
| Index Searches/sec | |
| Page Splits/sec | |
| SQL Server:Locks | Number of Deadlocks/sec |
| SQL Server:SQL Statistics | Batch Requests / sec |
| SQL Compilations / sec | |
| SQL Re-compilations / sec |
Click OK when finished selecting the available counters. Select Next.
Set the root directory for the log files to be placed, if different than default.

Select Finish to Save and close the new Collector Set.

Right click on the new User Defined Collection Set, and click Properties.

In the Directory tab, verify that the root directory and Subdirectory names are appropriate.

Under the Schedule tab, click Add and select the following day at 12:00 AM. If you select the current day, the log file will not start squarely at midnight and a daily analysis will take a bit more time.

Select the Stop Condition tab. We will be sampling every minute on this server, and wish to stop the counter each night just before midnight. Check the Overall duration checkbox, and set the value to 1439 minutes, which translates to 11:59pm. Click OK to close out of the collector properties window.

Right click on the new Collection set and select properties.

Select the File tab, enter ‘yyyyMMdd’ into the File name format, and check the box for ‘Prefix file with computer name’. Select OK to save.

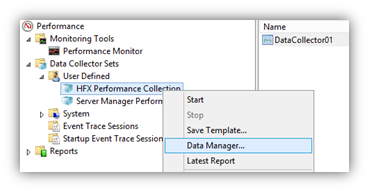
Right click on the User Defined Collection set again, and select Data Manager. This next step controls the amount of space consumed by the Perfmon data collection files.
Under the Data Manager tab, set the minimum free disk, maximum folders (equal to the number of days you wish to retain), Resource policy, and then check ‘Apply policy before the data collector starts’ and ‘Enable data management and report generation’. In this example, 500MB of free space on the C: drive will be retained, 120 days of logging will be stored, the oldest file will be deleted in order, and performance reports will automatically be created each night.

Next, we must clean up after the creation of the daily Perfmon reports. Select the Actions tab and select Add.

Create three Actions.
- 7 days, create cab and data files.
- 6 weeks, delete cab file
- 26 weeks, delete cab, data, and report files.
Your end result should resemble the following.

Now, to ensure that the log file starts at Midnight each night and stops other copies of the job that might be mis-scheduled, open Windows Task Scheduler. Perfmon actually uses the Windows Task Scheduler to routinely execute the job on the scheduled intervals. This job is well hidden. Expand Task Scheduler Library, Microsoft, windows, and select PLA.
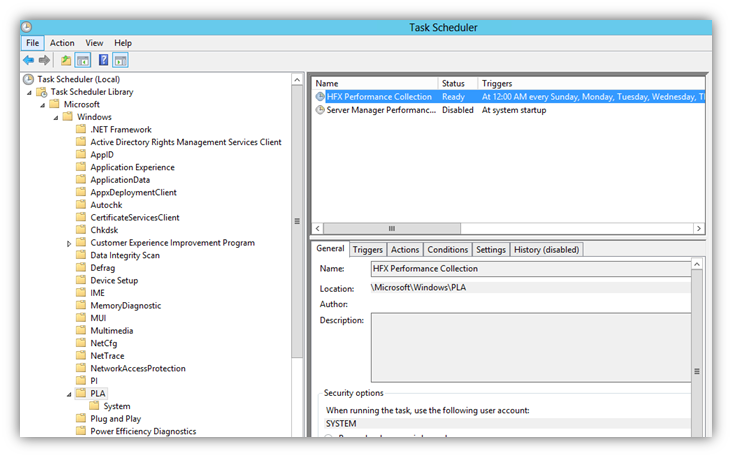
Right click on the job, and click Properties.
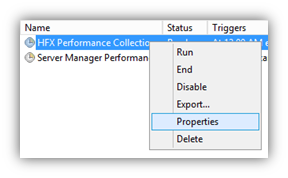
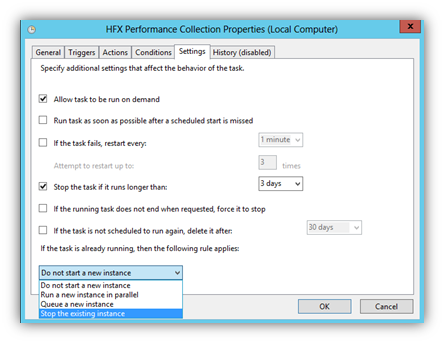
In the properties for the job, select the Settings tab, and change the dropdown menu at the bottom from ‘Do not start a new instance’ to ‘Stop the existing instance’.
Perfmon is now configured to set up and record all vital base-level system statistics of this environment. Feel free to tailor the counters and configuration to your environment’s requirements.