In the early days of virtualization, the core focus of virtualization was primarily consolidation. You could achieve quite high consolidation ratios, with some even as great as 20 to 1. This consolidation worked great for applications like file and print servers, development workloads, or other very lightly used servers. The virtualized servers that hold these servers are technically overcommitted on resources, but the workloads are so low that the end users would not notice the effects.
However, as more and more business-critical workloads are virtualized, maintaining this same level of consolidation is guaranteed to rear its ugly head in the form of performance degradation of the virtual machines. Most VMware administrators realize that resource overcommitment is slowing down their most intensive servers.
How can this be, you ask?
Few administrators know about a simple metric called CPU Ready.
What is CPU Ready?
Ponder this analogy for a minute.
Take a physical server, say with two CPU sockets and eight CPU cores in each sockets. You now have a total of 16 physical CPU cores in that server to use for virtual machine processing activity. I’m ignoring hyperthreading to keep things simple.
Let’s say now that you have ten virtual machines on this server, each with two virtual CPUs. You now have a situation where you are resource overcommitted, technically speaking. You have more than one virtual CPU allocated for every physical core.
This, in itself, is just fine. In fact, it is encouraged in just about every situation I can imagine.
But now, you know that each virtual CPU simply cannot get executed each and every time it needs to execute a command. It has to get into a queue so that it can be coordinated which process to execute next in line. I’ll call this the ‘Ready to Run’ queue.
Certain processes can cut in line if they are given priority through any number of means. Just know right now that they can cut in line, so this line is not necessarily 100% linear in nature.
Now, you see that a process gets to sit in a queue. The time spent in this queue, measured per virtual CPU, is called CPU Ready. VMware provides relatively easy means to see the performance statistics on this metric.
CPU Ready time is measured as the amount of time a virtual CPU spends in the ‘ready to run’ but not yet running state. The polling interval for the metric is every 20 seconds, and is measured in milliseconds. Therefore, if you see that a CPU Ready Time number is measured to be 500ms, perform the following calculation.
The percentage performance penalty is the penalty paid by that virtual CPU in having to sit and wait to be executed. You will not see anything reported in the Windows Event Log or SQL Server as unusual or flagged as broken. All you will notice is that you feel a drop in performance.
If you have running baselines of performance, you can benchmark the environment and objectively demonstrate performance levels.
How can I see it?
First, you need access to the VMware vCenter management interface. For those of you who do not, please reference this article for talking points as to why you desperately need this level of access.
First, log into vCenter. Select the virtual machine that you wish to examine. Click the Performance tab, and then select CPU from the drop down list.
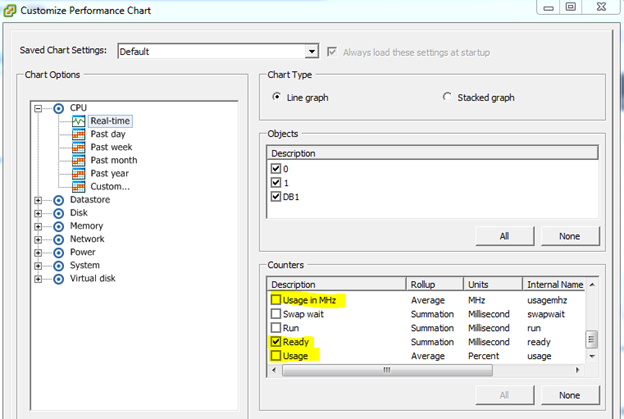
Now, CPU Ready is nowhere visible on this screen. To display the CPU Ready metric, select Chart Options.
Make sure that CPU Real-Time is selected, and start scrolling down on the list of counters to the right. Uncheck ‘Usage in MHz’ and ‘Usage’, and then select ‘Ready’. These screenshots are from vSphere 5.1, but the only difference with other versions of vSphere is that the order of this list is different.
Click OK. The graph now changes to display CPU Ready, measured in Milliseconds.
I will address some of the other long term baseline metrics within vCenter shortly.
Statistics Rollup and Misleading Numbers
The amount of data generated by vCenter that is stored in the database is large. Consequentially, vCenter has data aggregation routines that ‘roll up’ values generated every 20 seconds into average or sum values over time intervals that are larger than the default 20 seconds. You can see (ant alter, if necessary) these rollup values within vCenter. Just hit Administration, vCenter Server Settings, and click Statistics.
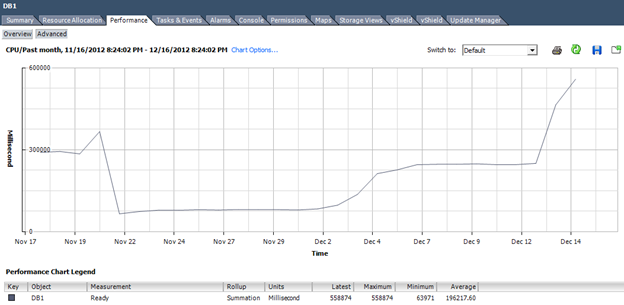
This rollup process skews the CPU Ready numbers, sometimes dramatically. For example, CPU Ready on a normal real-time display could look as follows.
But change the display to a monthly view, and CPU Ready looks much worse.
However, it is not as bad as it appears. Applying just a bit of math can get the real data out of this value.
Remember, CPU Ready is measured over a 20 second polling interval. A quick refresher: the calculation for real-time CPU Ready performance degradation is:
Therefore, a CPU Ready value of 1000ms equals a 5% CPU performance penalty.
Now, vCenter defines the default rollup periods, with data interval, as the following.
- Real-Time: 20s interval
- Daily: 5m interval
- Weekly: 30m interval
- Monthly: 2h interval
To see the average CPU Ready for the Daily view, examine the data interval. Five minutes is 300,000ms, or 15 times the time period as the Real-Time interval. Therefore, alter the calculation as follows.
Similarly, the Weekly view has a data interval of 30 minutes, which is 90 times as long as the Real-time interval. The calculation is as follows.
The Monthly view is now 360 times as long, which yields:
Now, remember that by increasing the time intervals, granularity in the data is reduced. Data can be skewed by spikes in the data, just like a spike in SQL Server disk activity can skew latency metrics in the DMV sys.dm_io_virtual_file_stats. Keep this in mind as you reference historical values from these data sets.
Detection and Alerting
Did you know you can set up a vCenter alert to warn on high CPU Ready metrics?
Fire up your vCenter client, login, and then select the VM you wish to create this alert for. Select Alerts, Definitions, and then right-click in the open area and select ‘New Alarm’.
Name the Alarm appropriately, and make sure you leave the other items on the General tab at their defaults.
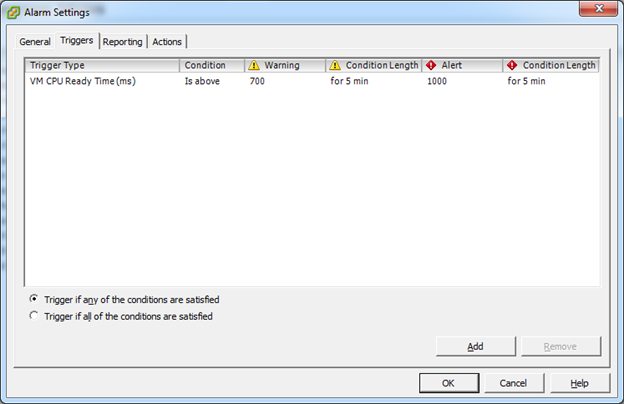
Now select the ‘Triggers’ tab. Click ‘Add’ to add a new trigger. Set the Trigger Type to ‘VM CPU Ready Time (ms)’.
Now, the values to warn and alert on are open to your environment and discussion.
First, for one vCPU, a CPU Ready Time of 1000 means a 5% CPU performance hit, and this is the value that VMware Corporation lists in their publicized materials around virtualizing business-critical systems. However, SQL Server is relatively latency-sensitive, and therefore a higher CPU latency could lead to performance implications that exceed the linear degradation listed. Your mileage may vary depending on your workload.
Second, this value is cumulative between the number of vCPUs the VM is assigned. For example, a one vCPU VM has the measurement of 1000ms. For a VM with two vCPUs, the same performance drop would rise to 2000ms, or 1000ms per vCPU. For a VM with four vCPUs, it would be 4000ms. You get the picture.
On my mission-critical workloads, I tend to disagree with VMware. I believe that for a highly performant SQL Server, you should set the CPU Ready Time warning threshold for 350ms, and the alert at 500ms – times the number of vCPUs allocated to the VM. Therefore, my alarm setting usually looks like the following for a two vCPU VM.
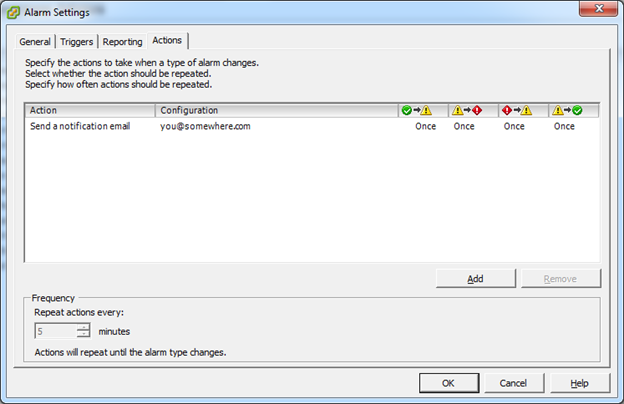
The only remaining item left in the alert is to define an action whenever this alarm is triggered. Click the Actions tab and configure an action to resemble the following. The alert actions per transition are up to your digression, but I like to know whenever any of the thresholds are crossed.
React accordingly if or when you get any of these emails!
Remediation
I’m sure that I have thoroughly scared you now, but that was not my intent (ok, maybe it was a little bit).
If you experience high CPU Ready values only every once in a while, watch your system performance during those times. If you find one VM spikes and you have a short performance hit on other VMs, if might not be something to panic over. Your mileage may vary. However, if you have excessive CPU Ready times most or all of the time, you really should do something about it.
The following checklist outlines some ways to deal with existing high CPU Ready values.
- Use resource pools to prioritize your critical servers
- Use CPU shares
- Better balance the workload on the existing VMware cluster
- Right size your VMs
- Check vHardware versions and keep up to date
- Add more resources to the VMware cluster and rebalance
Prevention
The easiest way to prevent high CPU Ready is simple – right size your virtual machines, and do not overprovision your host CPU resources. If you see high CPU Ready Time on a virtual machine, examine the host that it resides on. If you see quite a bit of high vCPU-count VMs, or one VM whose CPU activity is dramatically higher than the others, move it to a host without any of your SQL Servers on it! Observe the CPU Ready impact before and after this transition.
CPU Ready Time can make or break a database server’s performance levels. Monitor your CPU Ready Time closely and keep your servers running at the peak performance possible!
Performance Impact Demonstration
I am saving the performance demonstration of the impact of high CPU Ready times to the end of this article so as not to detract from the remediation, prevention, and conclusion.
For each of the two virtual CPUs in the polling window in the example above, the CPU Ready values are 47ms and 34ms, respectively. These values, when translated with the above formula, represent a 0.235% and 0.17% penalty in this virtual machine vCPU performance for that twenty second period.
This example was done with very light background activity. Eight virtual machines were running on the host where these screenshots were taken at the time.
Let’s ramp up the background load and run some benchmarks and see what happens.
With the identical background load, Dell’s DVDStore was used to run a twelve hour test to simulate a large amount of SQL Server OLTP activity.
After the SQL Server buffer cache filled and the test performance leveled out, the test was processing an average of 25,200 simulated web site orders of DVDs per minute by the 240 second mark.
VMware vSphere 5.1 realized that this workload was very resource intensive, and began to give priority to this virtual machine. Basically, it allowed these vCPU requests to cut in the ‘Ready to Run’ CPU queue.
Now, let’s fire up some background noise. I fired up almost every virtual machine in my test lab.
The host resource utilization levels climb.
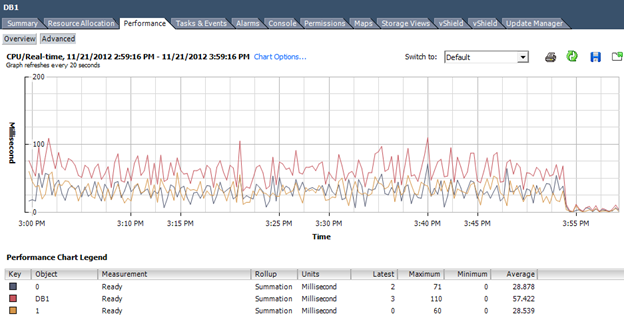
Immediately,  the DB1 virtual machine’s CPU Ready Time metrics start to climb dramatically, and then fall back off as VMware adjusts the workload.
The performance penalty per vCPU is now 303ms and 139ms, or 1.515% and 0.695%.
The host CPU statistics show dramatically more activity than before.
Shared CPU and disk activity could have all had a direct impact in the performance degradation of the test. At the 1000s mark in the test, the virtual machines that were previously powered on were shut down at the same time.
Note, as the background workload goes down, the orders per minute per line is starting to go back up.
That’s raw performance that was sapped from an overcommitted host with background activity causing the resource contention.
Now, let’s begin a more in-depth test. A second virtual machine running SQL Server is fired up and forced to coexist with the first virtual machine on the same physical host. VMware DRS rules are configured to keep these VMs together on the same host.
Both of these virtual machines are isolated on the same physical server together. This should allow us to control the background noise during the test.
The first test on the virtual machine DB1 is restarted. The SQL Server buffer pool is not flushed.
The test on DB1 throttles the CPUs up to near 100%.
CPU Ready values are insignificant.
After a short bit of time, the orders per minute value level out at around 29,000 orders per minute.
CPU Ready Time is very small.
The same DVDstore test is started on the second virtual machine, DB2. The same parameters are used, only this virtual machine’s resources were allocated eight vCPUs and 12GB of virtual memory instead of the two vCPUs and 4GB that DB1 is allocated.
After about six minutes the orders per minute performance of the DVDstore test on DB1 was examined.
That’s a significant performance penalty.
To top it off, CPU Ready is dramatically higher. Performance falls off again!
Part of the cause of this is the NUMA configuration on this server was intentionally set to imbalanced. You can see this fact in the CPU Ready of the intentionally misconfigured DB2 server.
That’s terrible! The performance is also miserable compared to DB1. Technically, it has four times the CPUs and three times more memory, but the performance is now one half of the other server!
So, when I mention ‘right sizing’ your virtual machines in any of my posts or presentations, I truly mean it. Too many resources for the workload, or a vHardware configuration that is not aligned to your physical hardware, can make or break a business-critical workload. I will be working on some comparison testing on this topic in a future post.
Finally, DB2 is shut down at the 1430 second mark on the DB1 test. The performance starts to return to normal. CPU Ready returns to normal too.
Increased CPU Ready metrics have a direct relation to decreased SQL Server performance.









Trackbacks/Pingbacks