 Not too many people know about the intricacies of virtualization CPU scheduling and its impact on the performance of the VMs, so application owners out there – listen up! I’ve written about Ready Time (VMware ESXi) / Wait Time Per Dispatch (Microsoft Hyper-V) in the past, but a different challenge arises with VMs that have large vCPU count footprints. It’s called CPU Co-Stop, and it can devastate your application’s performance in a VM.
B e warned: I have not found an equivalent counter in Microsoft’s Hyper-V platform, so if anyone knows about a counter that is similar, please let me know. This system state is sure to exist in every virtualization platform, and is a possible performance killer.
You’ll need access into VMware’s vCenter Server to see this metric. It’s not visible from inside the VM. At least read-only access is advised, and if you’re a DBA, you need access into this layer anyway so you can better do your job.
First of all, a hypervisor metric called Ready Time / Wait Time Per Dispatch indicates that the hypervisor is queuing up the VM’s requests for executing tasks on the physical CPUs. The amount of time taken in the vCPU scheduling queue during an individual scheduling queue is measured, and the percentage performance hit on that vCPU is measured and reported. This metric is fairly easy to understand if you are given the math and explanation. But, what about the scheduling of a widely parallelized process or task, such as a database query that is executed on all vCPUs? Is it different?
It’s worse.
In early versions of the hypervisors, if you had multiple vCPUs on a VM and executed a task that needed all available vCPUs to process a task, the host would need to each physical CPU free before that task would be executed in parallel. It was very strict, and it meant that the performance overhead was exceptionally high. Newer versions of the hypervisor have a relaxed CPU ‘co-scheduler’, where the CPU queues for a VM’s vCPUs might not execute exactly in parallel, but that the performance impact on the source VM and background VMs on the same host is not as great. However, as a result of this overhead, the overall time taken to execute that task is limited by the slowest physical CPU, or most bottlenecked CPU queue, in the group. Even with relaxed co-scheduling, sometimes all the vCPUs need to be scheduled to run simultaneously, and this is where Co-Stop comes in to play.
VMware’s CPU Co-Stop metric shows you the amount of time that a parallelized request spends trying to line up the vCPU schedulers for the simultaneous execution of a task on multiple vCPUs. It’s measured in milliseconds spent in the queue per vCPU per polling interval. Higher is bad. Very bad. The operating system is constantly reviewing the running processes, and checking their runtime states. It can detect that a CPU isn’t keeping up with the others, and might actually flag a CPU is actually BAD if it can’t keep up and the difference is too great.
If you see blips above zero, you’ve got a performance challenge. The higher the number gets, the worse the performance impact can be. And… it’s not just the performance of this VM. It’s the performance of all of the VMs on the host. The vCPUs on the other VMs are sure to be impacted by this scheduling delay, and their performance will be negatively impacted as well.
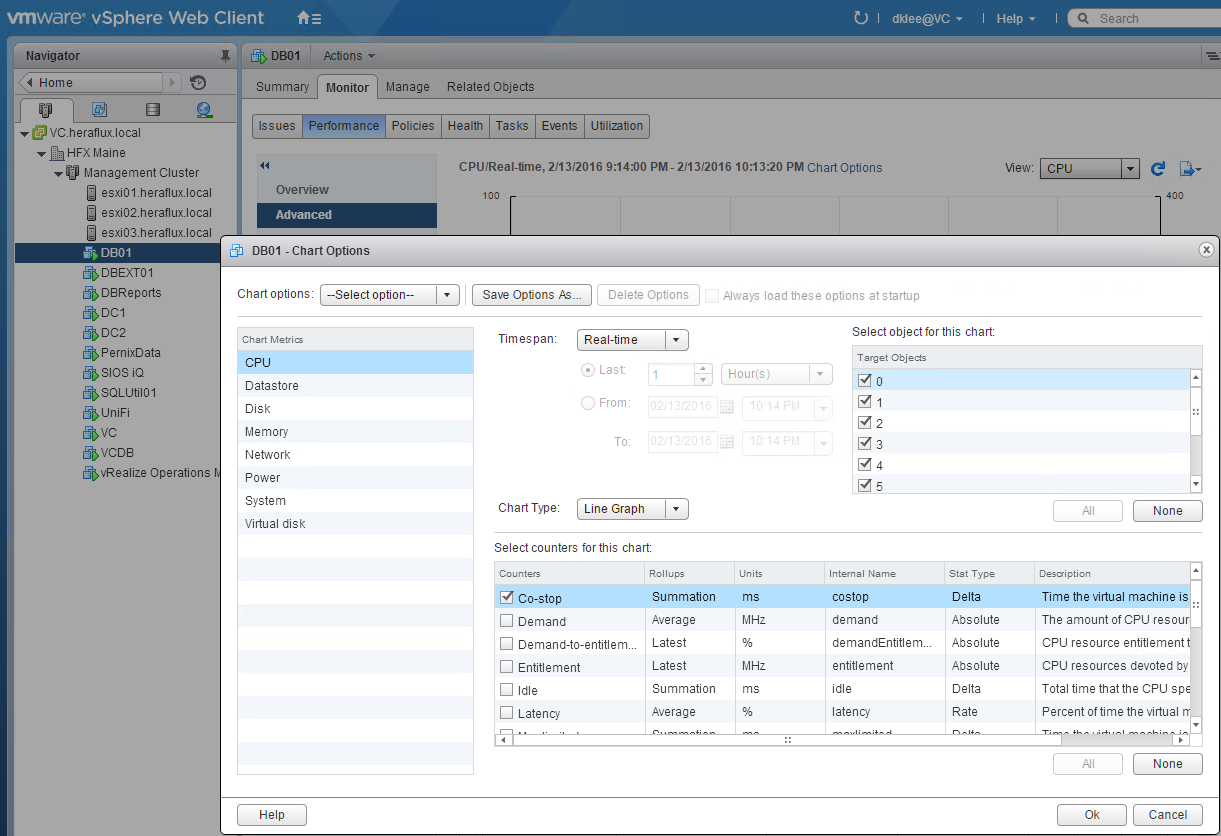
To view the Co-Stop values for one of your SQL Server VMs, open the vCenter Server web client link provided to your by your VM administrators, select your VM, select the Monitor tab, select Performance, and then Advanced. Click the CPU view and then Chart Options. Select ‘Co-Stop’ under real-time stats.
The numbers that you see are milliseconds per 20-second polling interval that are spent in this paused state.
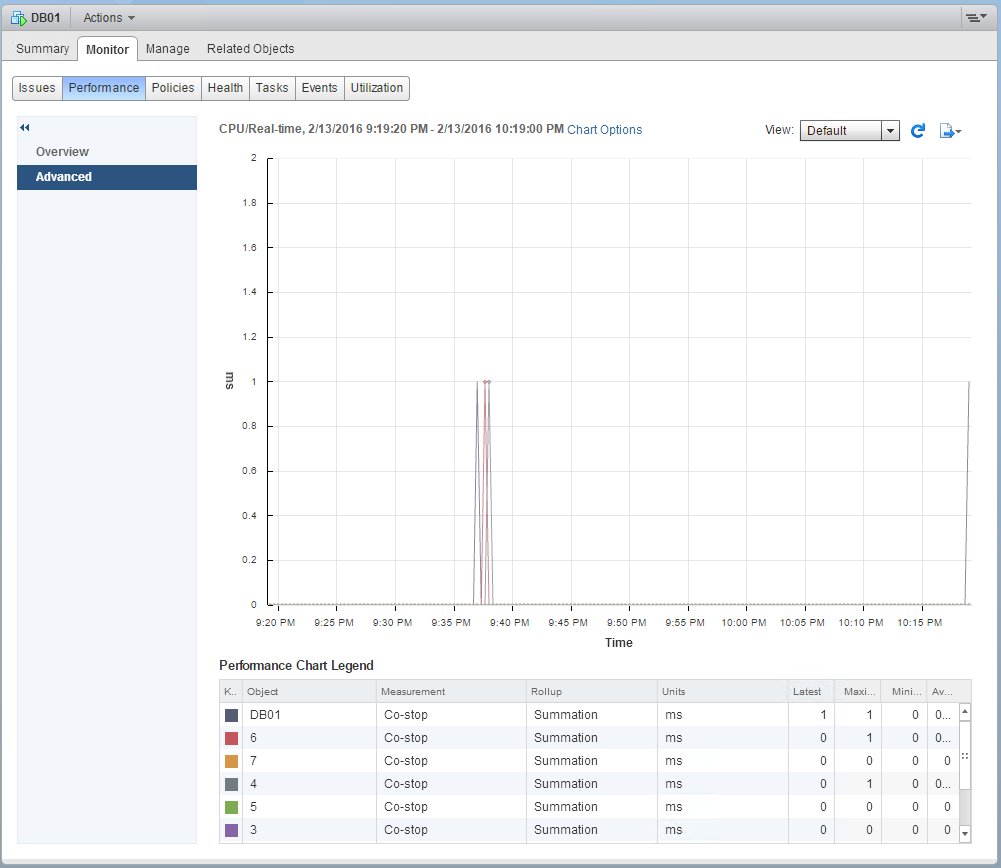
This VM is healthy (at least from this view). Occasionally you’ll see small blips, and that’s OK. It’s when you see higher Co-Stop times that are sustained over minutes or hours where you get the large performance impacts. I’ve seen this value over 8000 per vCPU, and that VM took a performance hit over 90%.
I want to see sustained numbers no greater than 10ms per polling interval. Not 10 percent, mind you… 10ms.
SQL Server will widely parallelize high impact queries across as many CPUs as it can, up to the number set in the Max Degree of Parallelism setting. If come of these vCPUs are artificially slowed down to let the others catch up, your query performance will suffer. This delay is one that is more immediately felt than Ready time.
What can we do about it? You can reduce the number of vCPUs on the VM, but only if you can prove that you do not need all of them. You can “right-size” the VMs with the right number of vCPUs and/or the right vNUMA configuration to match the physical server’s NUMA configuration. You can move background workloads to other hosts to reduce the load on the host that your impacted VM is running on. You can reduce the background activity on the physical CPUs by throttling back background VMs using resource pools or CPU throttling, if necessary.
Whatever you do, go to your VM administrators if you experience sustained high vCPU Co-Stop times. They might not be aware of this problem, or even know what Co-Stop is.
Please be warned that if you are running a critical SQL Server or other mission-critical application with a snapshot on the VM, you might experience high vCPU Co-Stop times, and your VM’s performance can considerably suffer. VMware even has a KB article on this topic. Please make your VM administrators aware of this challenge. Â Do not use snapshots as a temporary backup for your critical VMs – EVER.
Thanks David for raising awareness of another great contention indicator.
The rule I use for a co-stop threshold is approx 3% in esxtop (or a VM summation of 600ms in vCenter assuming a 20sec polling period). Lower is always better but setting a threshold near 0 is inciting pre-mature panic. Its affect does escalate quickly so agreed it needs to be kept in good hygiene.
Here’s one of our KB articles with good information as well:
https://kb.vmware.com/kb/1017926
Another great ESXI scheduler reference:
http://www.vmware.com/resources/techresources/10345
(it is dated for vSphere 5.1 but the majority of the concepts apply – update coming in 2H2016)
Mark, these are great tips! However, I have found that SQL Server is extremely sensitive to Co-Stop elevations at a much lower threshold than Ready times. A threshold of 600ms per vCPU would nail the performance of a normal SQL Server for a brief window of time. I still stand that it should be as close to zero (ideally zero) as possible.
I’m working on some lab scenarios where I can objectively test this one! Have any tricks up your sleeve to help me simulate this?
David, is there any way to get the actual T-SQL queries that would show this? I have access to the VM monitor, but being able to script it out would give me extra abilities I don’t get from the UI. I’d try and use profiler to grab them, but chatty and obtuse don’t begin to describe the queries I’m seeing in profiler.
Yup! Here you go 🙂
https://www.davidklee.net/2016/04/08/vmware-cpu-co-stop-and-sql-server-performance-continued/
This could be worth a read. I found this when trying to understand the nitty gritty about Hyper-V’s CPU scheduler. The summary is basically Hyper-V was designed around not having to schedule CPUs in parallel and Server 2008 and newer and newer versions of the Linux kernel do not have the requirement for scheduling CPUs at the same time. I wonder if we’ll see VMware take advantage of that fact at some point.
http://www.virtuallycloud9.com/index.php/2013/08/virtual-processor-scheduling-how-vmware-and-microsoft-hypervisors-work-at-the-cpu-level/